

Market Snapshot - COVID-19
Market Snapshot in Review
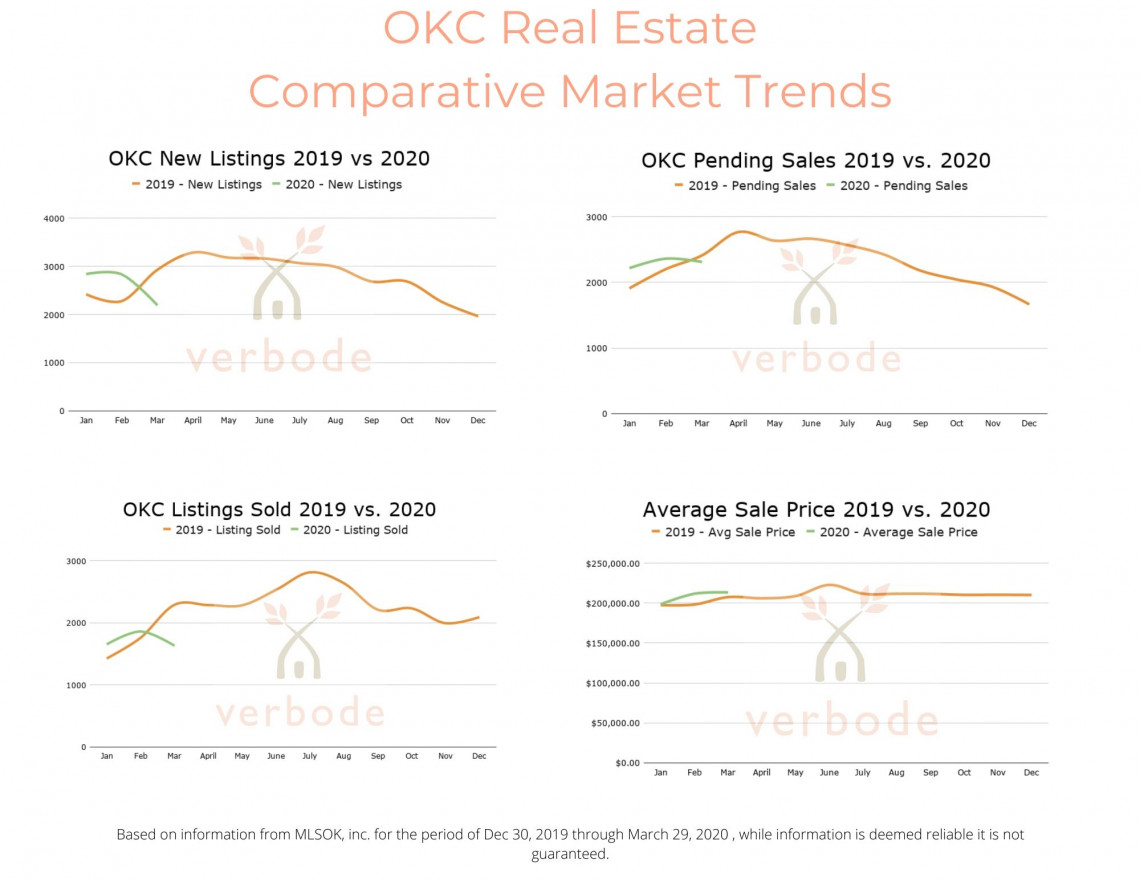
Fourteen weeks ago Verbode decided that we needed to pull weekly data to show how the market has been moving. We have been publishing this data in this blog and in social media to let you know how the market is moving. Since the start of the pandemic, we realized how valuable this information is in letting our market know how real estate is being affected.
We decided to start charting it against the previous year to show you what the market should be doing against what it is doing. Oklahoma has a pretty consistent seasonal curve and spring has always been our peak selling season. The orange line is the previous year and the green line is our current year. You can check with us weekly to see how the market is moving through this pandemic. We are happy to discuss your needs and how they can be safely met.